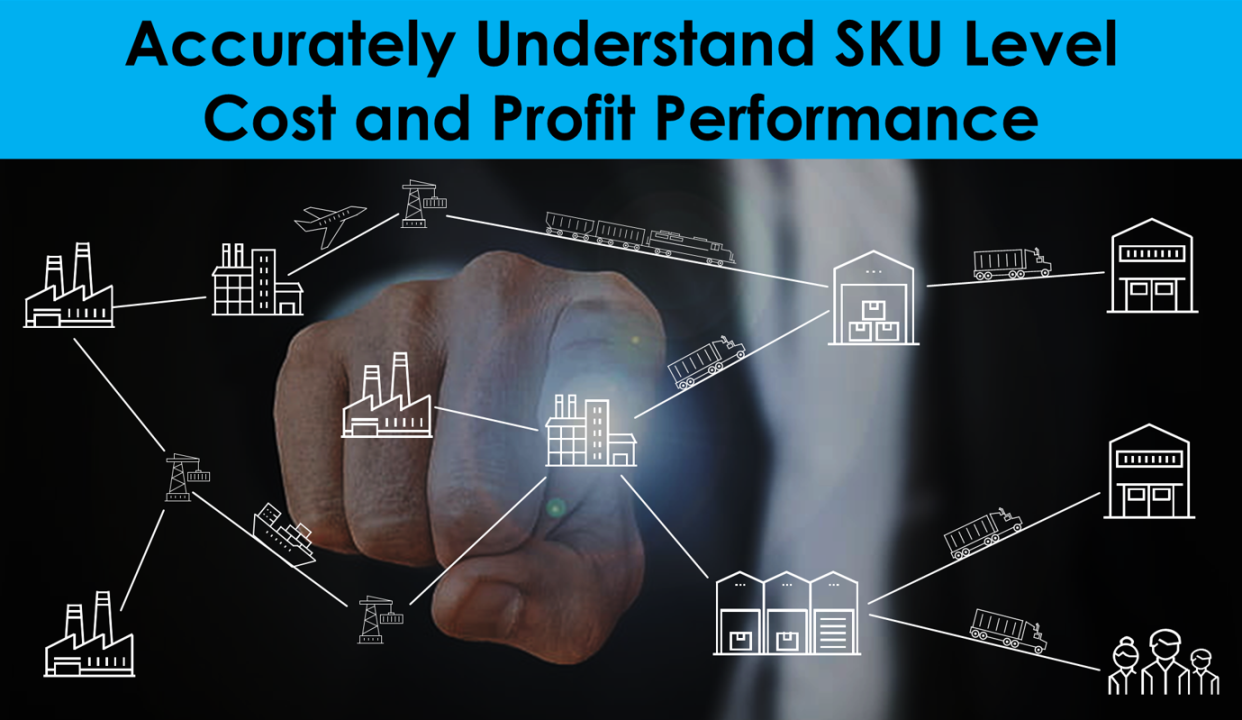
accurately understand SKU level cost and profit performance

Accurately Understand SKU Level Cost and Profit Performance

S&OP with Profit
tackle supply chain stress

Smartly Pinpoint Significant Cost Reduction Opportunities

Accurately Understand SKU Level Cost and Profit Performance

Smartly Pinpointing Significant Cost Reduction Opportunities

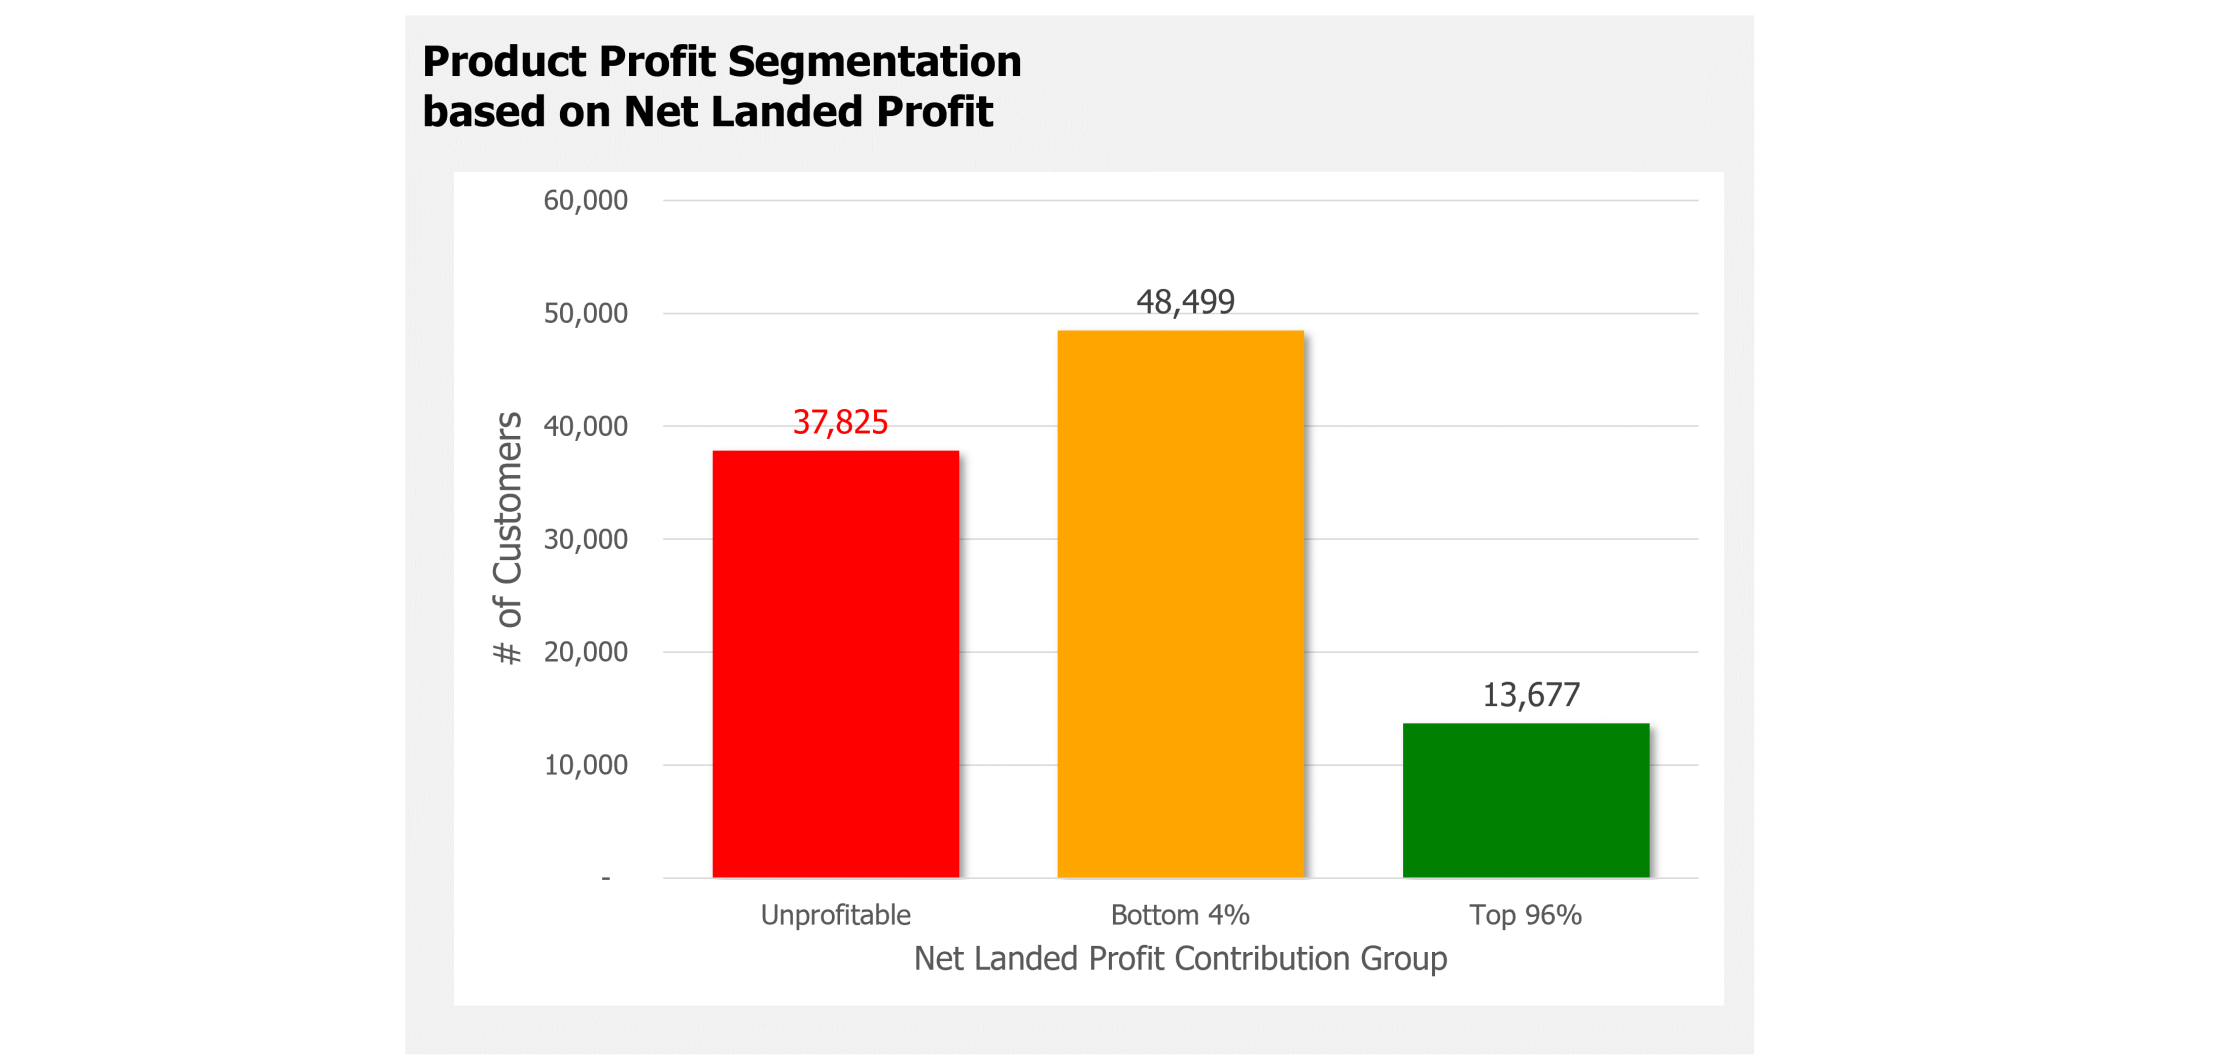
37,825 unprofitable products adding $608 million in operating costs and draining $146 million from the profitable performance of the company

Companies are pursuing aggressive strategies to reduce costs and operating complexity while still delivering expected profit contributions and shareholder value. Using price increases, package down-sizing and re-negotiating supplier agreements can have damaging, long-term impact on customer and supplier relations.

In contrast, some progressive companies are taking a more proactive approach to reduce cost and operational complexity by doing a rigorous review of their product portfolio. (Osprey – Hydroflask: https://www.supplychaindive.com/news/osprey-hydroflask-helen-of-troy-supply-chain-overhaul/649176/ )

Another case in point is for a well-known global company that continued to increase the size of its Product Portfolio sold through three different Channels. The global Head of the Supply Chain knew that this was adding operational complexity and costs. He also knew that the answer to solving this problem was to gain accurate, specific and repeatable cost and profit performance for every SKU in their portfolio.

As with most companies, this company had a host of data sources that were siloed and difficult to use. Having previous experience with these issues, he charged his organization to find a solution that was scalable and that would provide a significant ROI every month. A solution was selected and found the following results:

Product Segmentation by Net Landed Profit Product Segmentation by Net Landed Profit

As you can see, there were 37,825 unprofitable products adding $608 million in operating costs and draining $146 million from the profitable performance of the company.

Inflationary pressures are a significant concern for all companies. Understanding the ROI on where a company’s resources are being applied is critical as it relates to the actual costs being applied to servicing Customers, Channels and Regions and their Product orders. Having accurate, specific and repeatable insights to Cost and Profit performance produces actionable strategies that have extremely positive results.

Please comment on this posting or email me at [email protected]

All the best,

Richard Sharpe
CEO – Competitive Insights

Strategic Portfolio Decisions – Tackling 2021

Richard Sharpe Analytics & Big Data

Strategic Portfolio Decisions – Tackling 2021

reduce SKUs by 20% or more

Summary

2020 was a year of extremes, from seeing five-years of Business to Consumer growth projections being realized in months to the devastating reduction in Food Service and Restaurant revenues and employment.

2020 was also the catalyst for innovation including the evaluation of portfolio strategies to focus on the products that will drive strategic growth. Here is a synopsis from the Wall Street Journal:

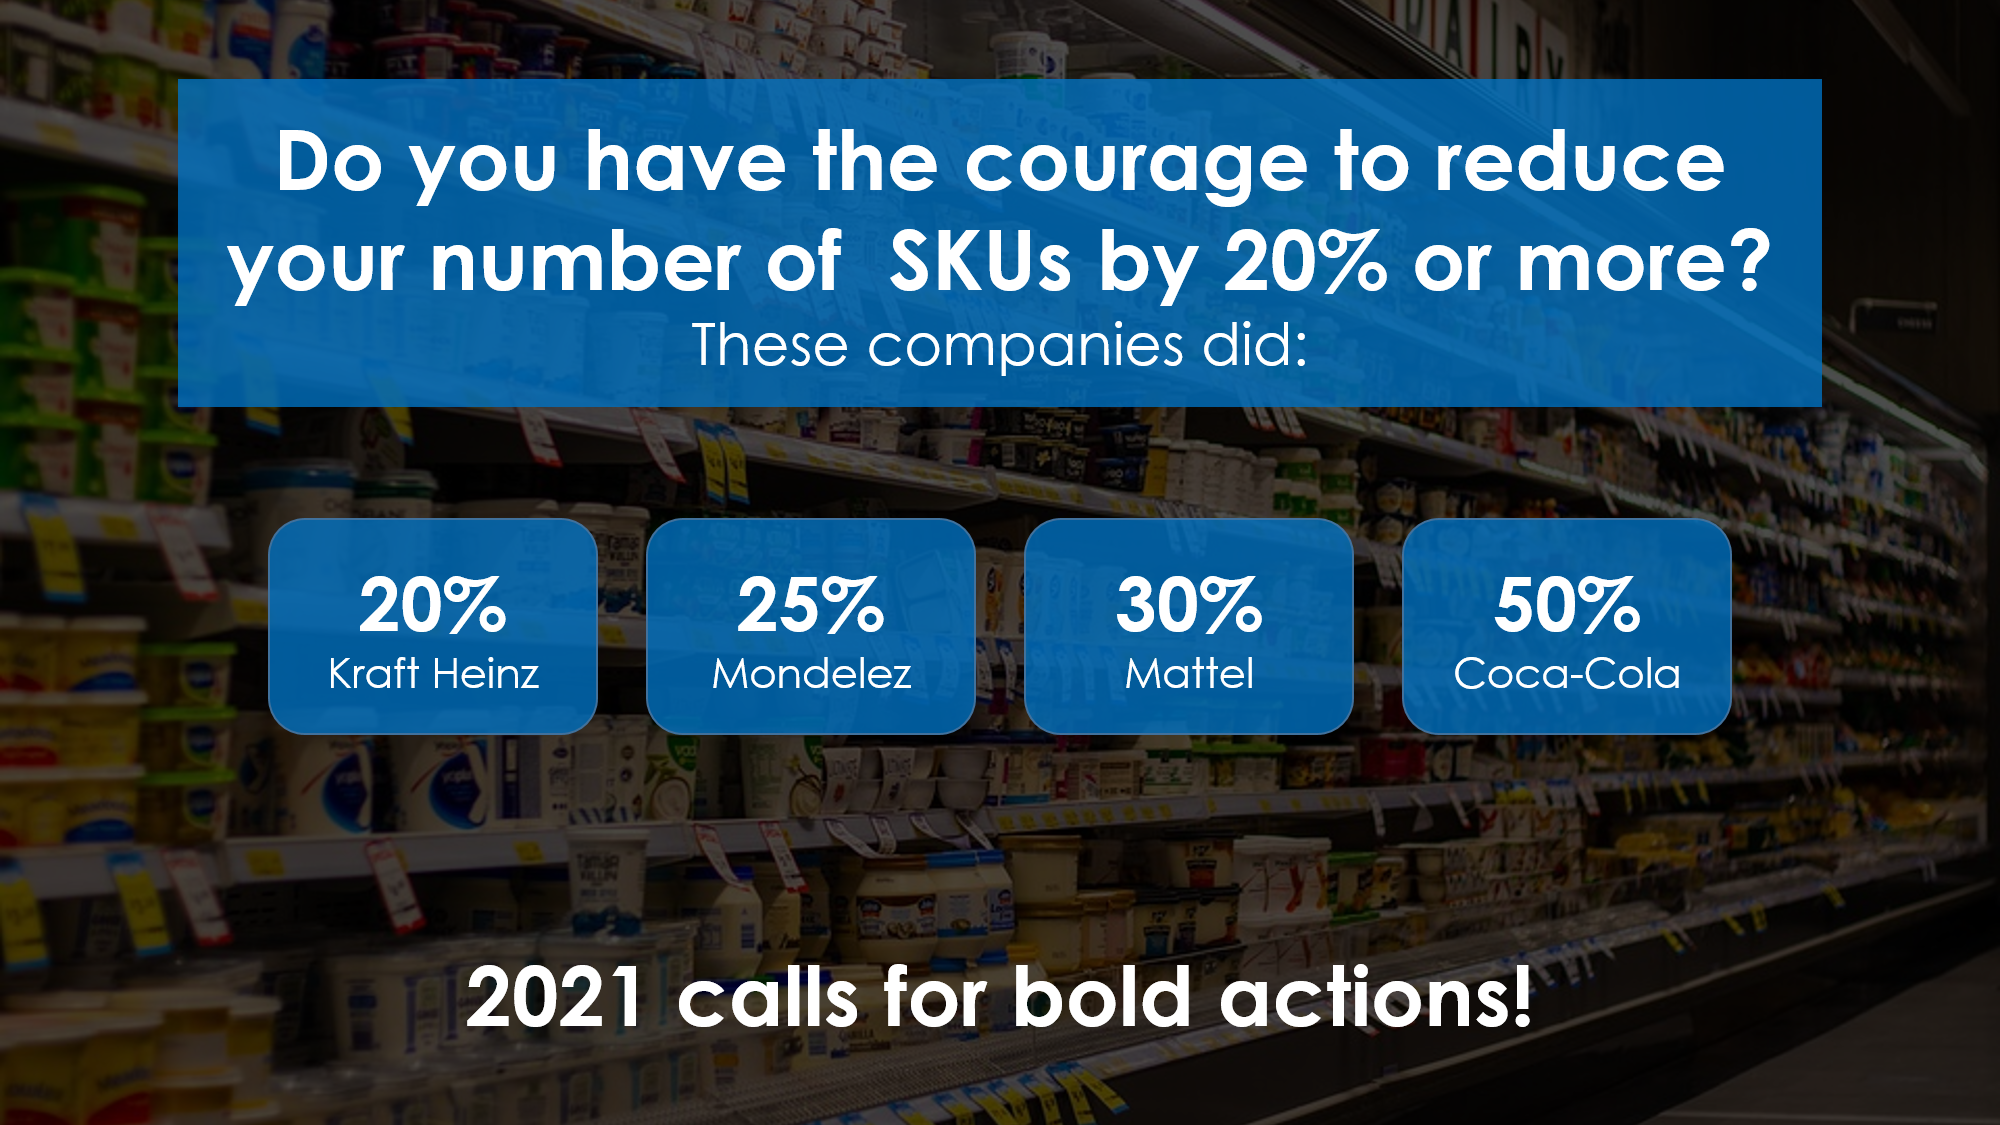
In May, Mattel CEO Ynon Kreiz reported the company reached a 30% SKU reduction eight months ahead of schedule — contributing to a $92 million cost reduction program

"This is an important achievement that will allow us to improve the match between demand and supply, optimize manufacturing decisions, improve customer fill rates and capture additional revenue opportunities," he said.

Benefits

Companies are strategically focusing on products that will produce outsized gains in market share, revenue and profitability. Strategies that are focused on providing clarity for the prioritization of cross-functional activities while significantly reducing complexity and operating costs.

The goal for all companies during the early stages of the pandemic was survival. However, many companies began to plan beyond the next few months by recognizing that “the long end of the profit offering tail” was adding unnecessary complexity and consuming operational capacities. Others are just now beginning to recognize that need. Here is a quote from Peter Bolstorff - EVP, Association for Supply Chain Management:

It's that population of laggards that are now just waking up and saying, 'Oh my gosh, I gotta do something or I'm not going to survive.'

Decision Criteria

So how are companies making these portfolio decisions?

Clearly considerations have to include sales volumes, brand considerations market share, forecasted demand, resource requirements and competitor analysis. However, industry leaders are incorporating one additional critical in the pursuit of strategic growth; the specific cost to serve profit performance for each product in the portfolio.

Doing this in-depth evaluation on an entire portfolio can be an expensive and time consuming for those without experience in building these solutions. Advances in expertise and technology have significantly reduced the time and resources to implement this effort.

Here is an example. A profitable CPG company had historically sold over a 100,000 SKUs through three different channels. Wanting to improve their portfolio performance, they needed to understand what products were great performers and which ones were marginal or unprofitable. Analyzing billions of transactions using 15 months of data, they found that 7,000 products were generating 80% of their entire profitable performance.

Think of the complexity of the supply chain to support delivering 93,000 products and only getting 20% of your profit (marginal products). Using profit analytics, how many products should be dropped, how much cost could be eliminated? Ask Coca-Cola who dropped 50% of their product lines to eliminate 1% of their profit. source

Conclusion

2020 was a challenging year that served as a catalyst for innovation and reflection. It was a year that drastically challenged the ability to meet channel requirements and buyer expectations. It also served as a wakeup call that an ever-growing expansion of product offerings does not necessarily meet the strategic growth requirements for a company and it’s shareholders.

Informed profit based portfolio decisions are part of the new post-pandemic operating model. Are you ready?

Please comment on this posting or email me at [email protected] .

All the best,

Richard Sharpe

Richard Sharpe

Richard Sharpe is CEO of Competitive Insights, LLC (CI), a profit contribution analytics firm that specializes in helping clients efficiently and continuously transform multiple sources of data into actionable operational insights.

Thriving After COVID – Essential Step 3 – Profit Analytics Drives Coke’s Bold Strategy

Richard Sharpe Analytics & Big Data

Thriving After COVID – Essential Step 3 - Profit Analytics Drives Coke’s Bold Strategy

Coke did

On August 22, one of the world’s most iconic brands announced that they will reduce the number of brands in their portfolio by 50%. James Quincey, CEO of The Coca-Cola Company, stated in The Wall Street Journal;

"now is the time for Coca-Cola to cull the portfolio of the many small, less profitable, resource-depleting brands"

It is hard to find a company that has not experienced a significant impact from COVID and the Coca-Cola Company is no different requiring strategic action. Coke announced cost cutting measures such as a workforce reduction of 4,000 employees. But Coke also is taking decisive action by cutting half of its product brands.

“All told, the 200 brands slated to be discontinued account for only about 1% of the company’s profits. They consume too much attention and resources, Coke leaders said.”
Atlanta Journal Constitution October 22, 2020

Are you prepared to walk into your Board Room and recommend cutting half of your products based on their profit contributions?

Roadblock 3: Moving Beyond Traditional Product Portfolio Decisions

Portfolio decisions are based on a number of key criteria. Often the focus is to maintain a competitive advantage by anticipating customer demands that drive increasing revenues. This reminds me of a story for an Apparel company.

The head of the supply chain was dealing with a significant increase in SKU proliferation. Apparel supply chains are very similar to many industries in that they are very complex. They operate on a global footprint that involves multiple tiers of suppliers and service providers. He needed to find a way to reduce the cost and complexity of his operation.

His question was “can we measure the profit contributions below the SKU level to the actual performance by the article’s color?” Fortunately, his organization had trusted, actionable data. They had built accurate, detailed Revenue and Cost to Serve information, down to the color level. At the next product planning meeting he came armed with meaningful profit analytical insights and stated;

“We have never made one dollar of profit on any item that we have sold across all categories with the color fuchsia. Why are we including this (fuchsia colored products) in our next set of product releases?”
Executive Vice President – Supply Chain Operations

Continuing to measure SKU performance, his company was able to cut inventory, increase profitability, release capital for more productive uses and reduced operational complexity.

Einstein quote

Meaningful Analytics To Drive Smart Portfolio Decisions

Summary

COVID has served as a wake-up call. Shareholders and stakeholders are going to mandate that company executives can measurably demonstrate they are adding resiliency in their ability to generate and protect shareholder value.

Here are the key takeaways:

  • Standard accounting measurements do not provide the detailed visibility needed when measuring product and customer performance.
  • For most companies, the 80-20 Rule overstates the specific products and customers that provide the vast majority of profit contributions.
  • Having fact based, trusted profit analytics MUST be a key catalyst for establishing portfolio strategies for corporate growth and profitable performance.
  • Potentially redirecting resources away from marginal and unprofitable products and customers increases the return on operating investments in addition to reducing complexity.
  • Global supply chains must be managed by having visibility to changing profit opportunities and potentially disruptive events. This visibility must be available and used on an ongoing basis.

Empowering the organization with repeatable, fact-based profit contribution analytics provides the foundation for thriving and not just surviving in stable and disruptive times.

The Coca-Cola Company recognized this. They acted in a very bold and proactive manner.

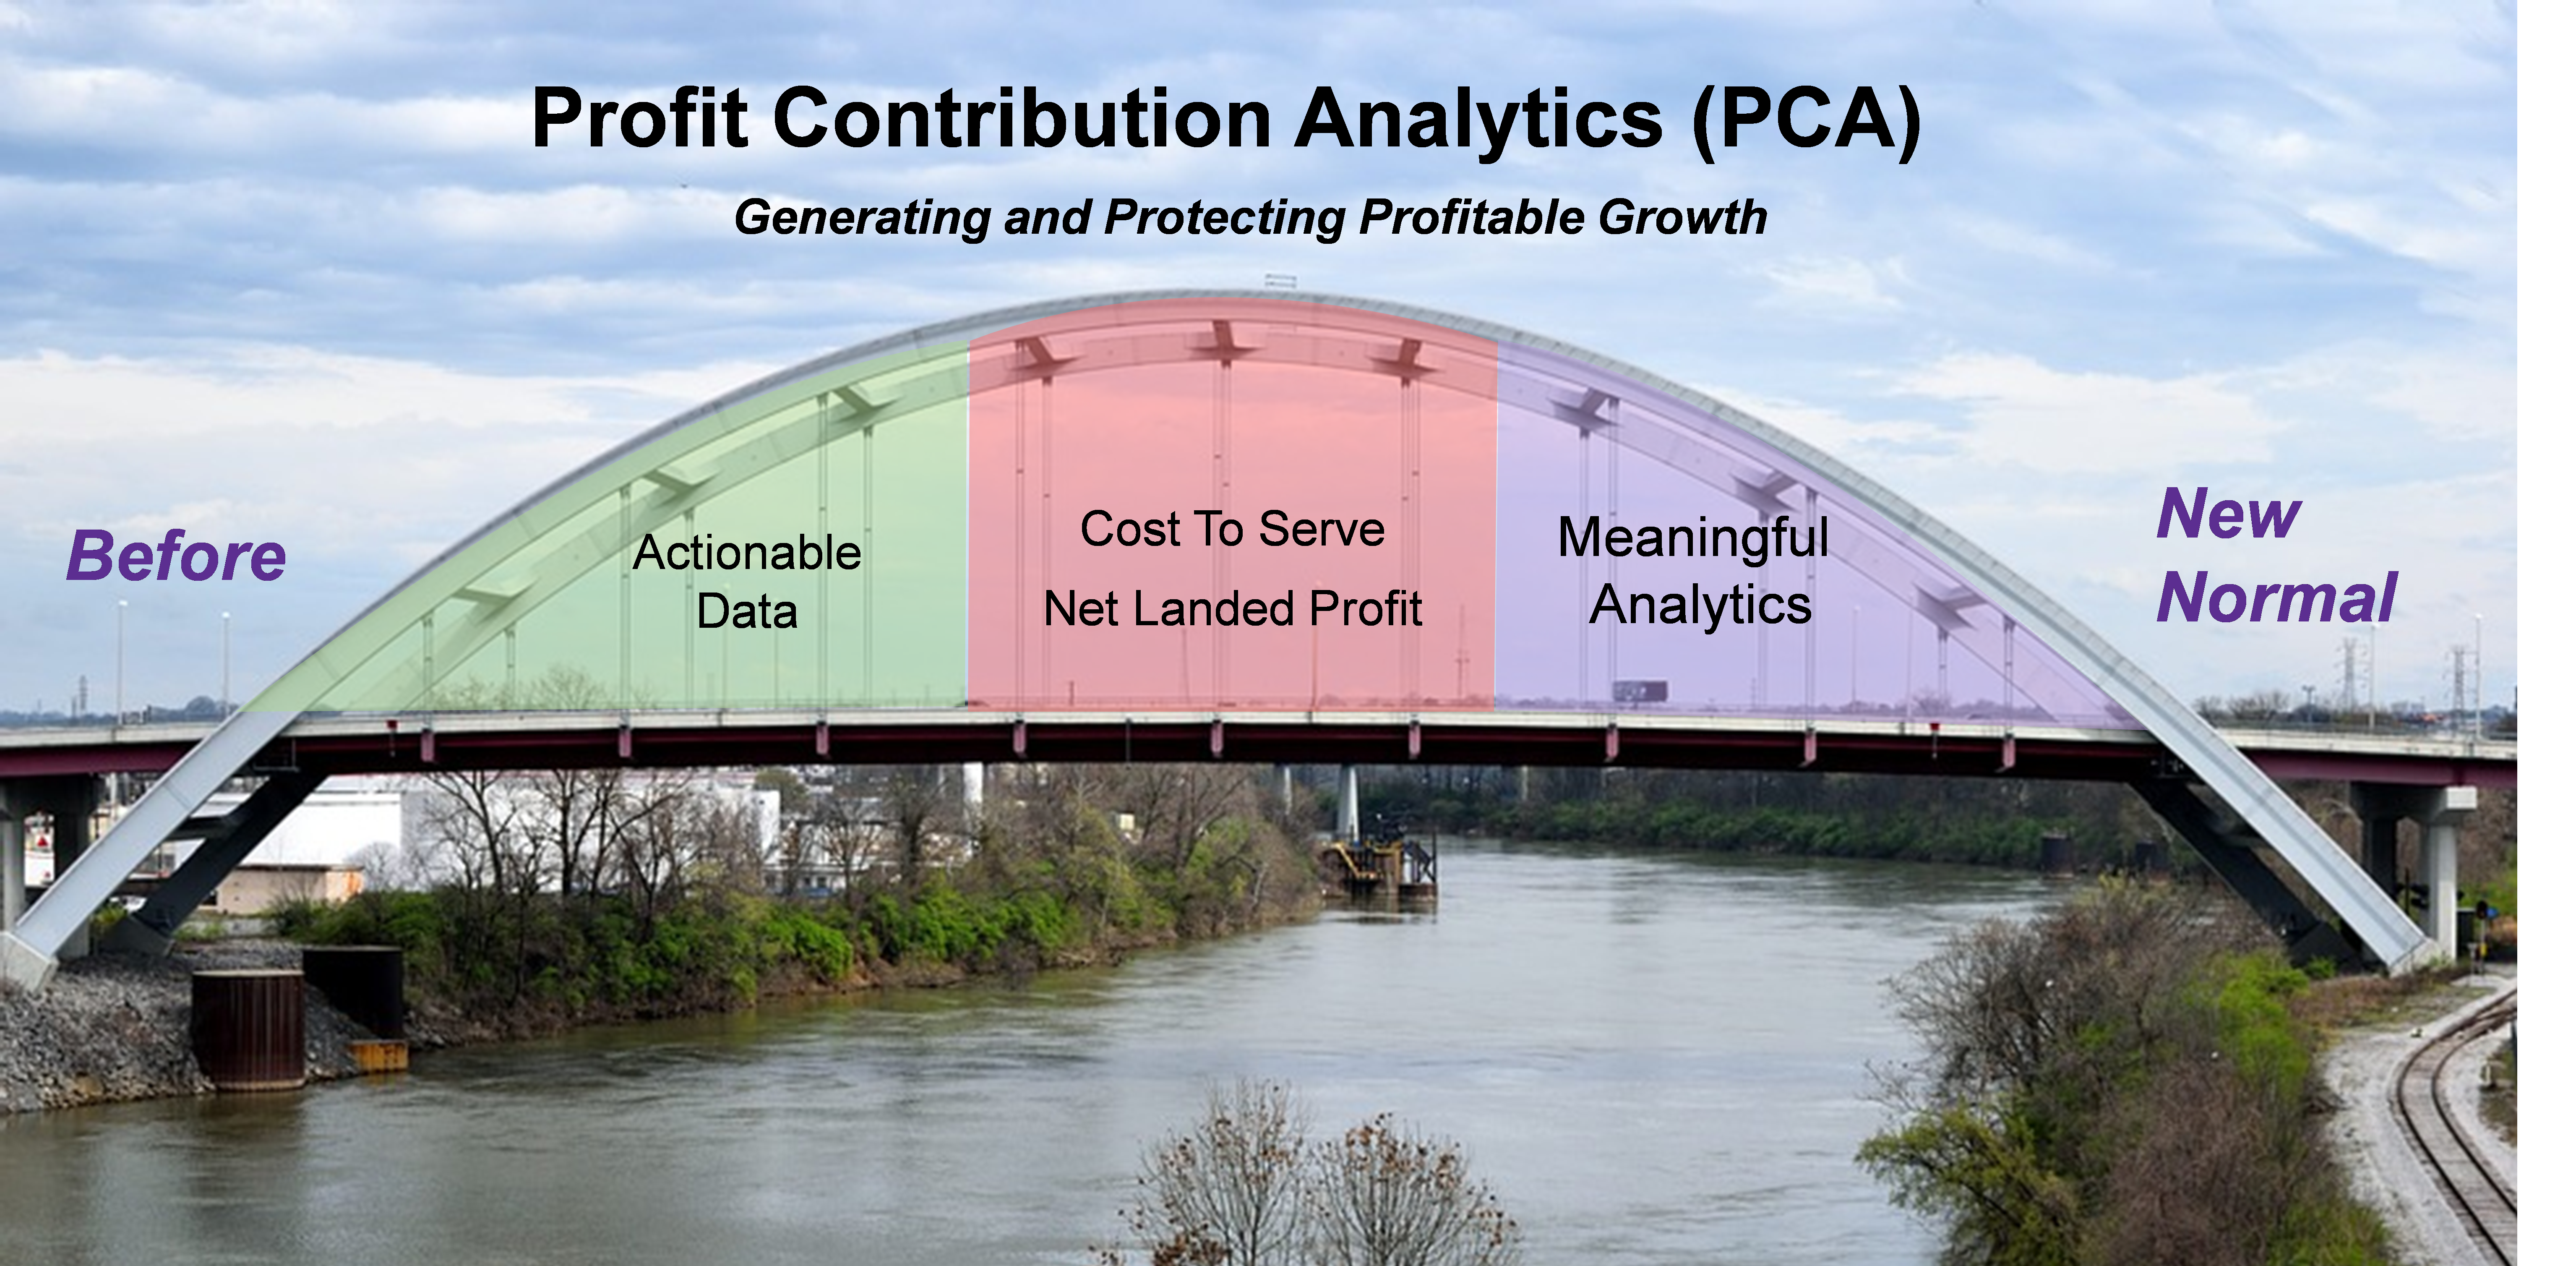
Will you have the courage to push to focus on only products that drive sustainable profits to guide your company to thrive and not just survive? Do you have the information you need to back it up? Are you ready to cross the bridge?

Please comment on this posting or email me at [email protected] .

All the best,

Richard Sharpe

Richard Sharpe

Richard Sharpe is CEO of Competitive Insights, LLC (CI), a profit contribution analytics firm that specializes in helping clients efficiently and continuously transform multiple sources of data into actionable operational insights.

Best Practice Bridge

Global Analytics Survey – Recognition, Frustration & Best Practices

Richard Sharpe Analytics & Big Data

Global Analytics Survey – Recognition, Frustration & Best Practices

Recognition

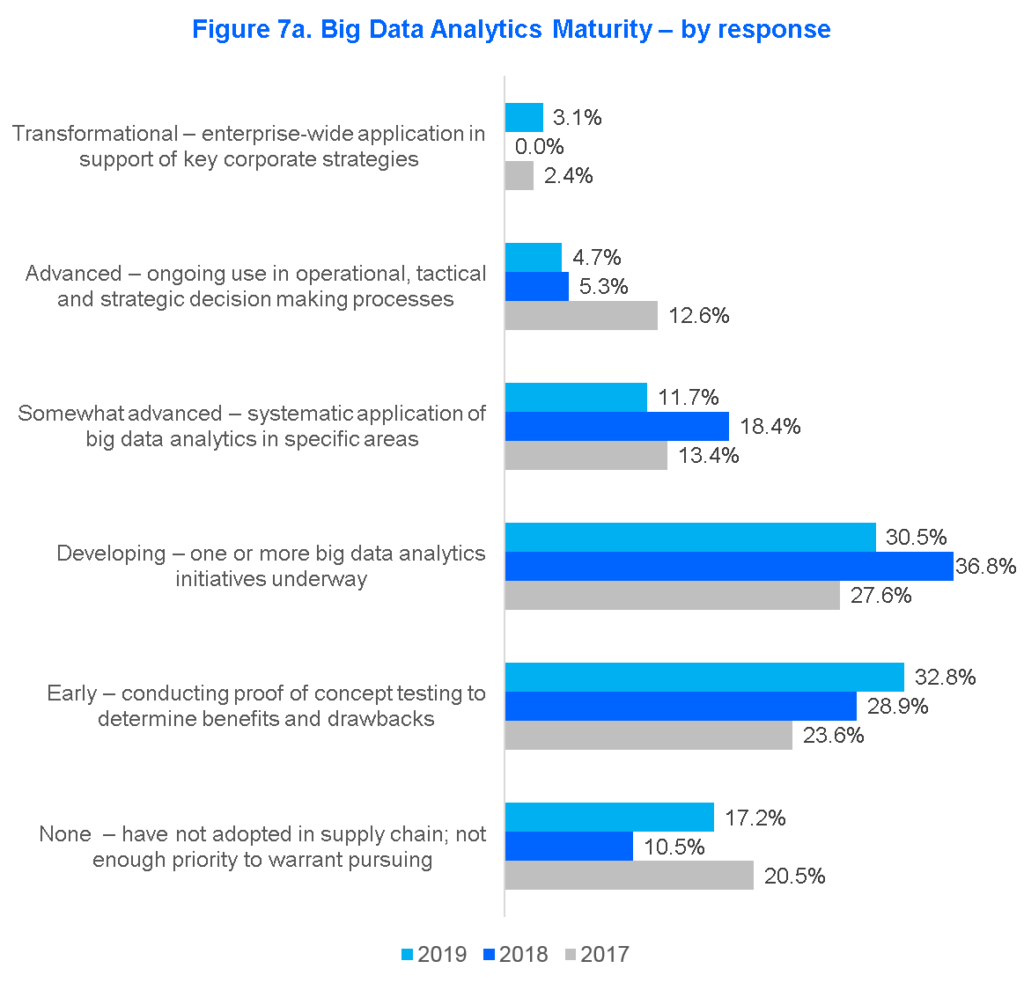
For three years, Competitive Insights has had the privilege to help orchestrate the Annual Analytics & Big Data Benchmark Study published in Supply Chain Quarterly and DC Velocity each year. As in past years, the responses from the participating companies indicate that most feel that they are early in their journey in achieving that full potential that is possible form Big Data Analytics as demonstrated below:

Big Data Maturity


Frustration

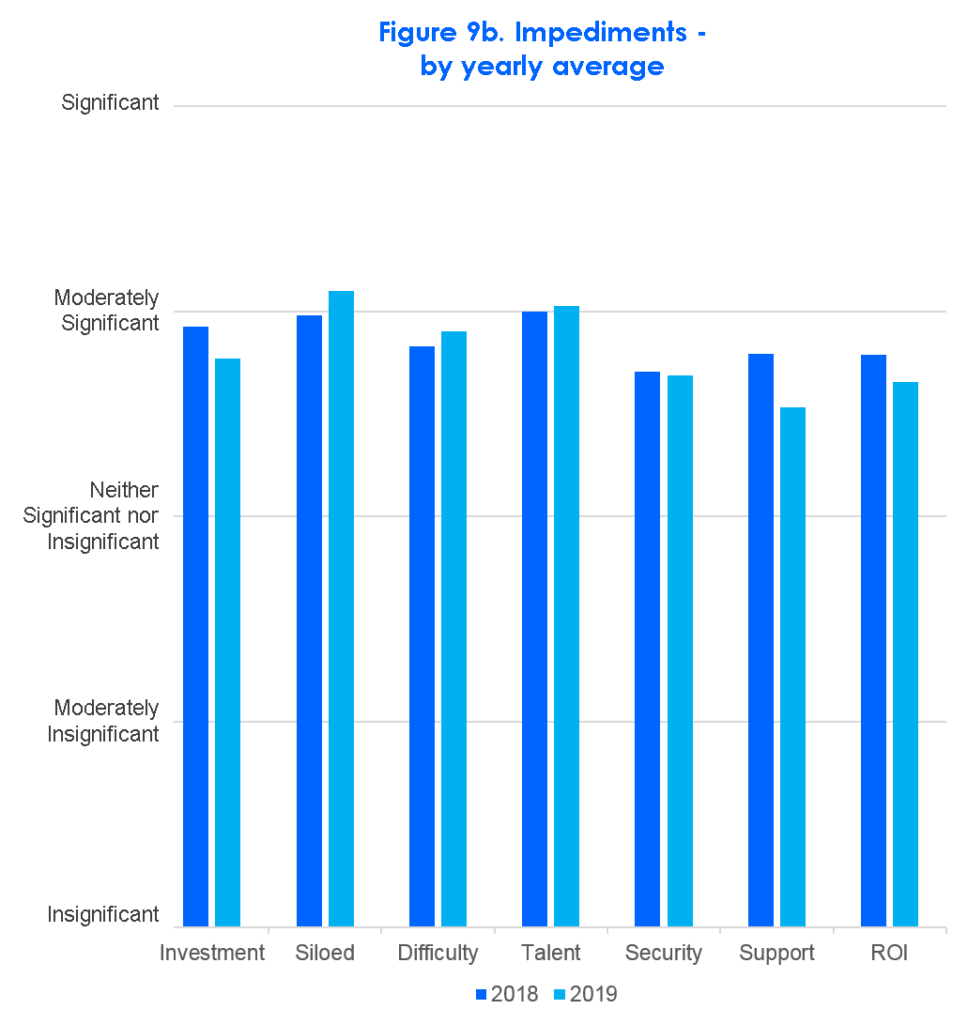
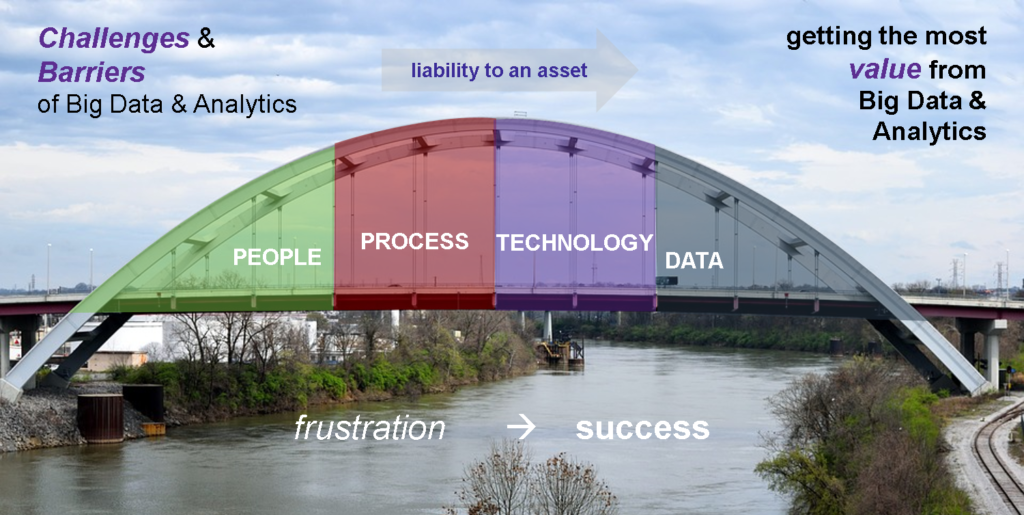
So what is holding companies back from realizing the full value that can be derived from the sustainable use of Big Data Analytics? Frustration for achieving success can be associated with people, processes, technologies and data related issues. The complete results of the survey is available by request.

Big Data Impediments

Action

How can companies accelerate their progress and get the most value from their Big Data Analytical initiatives? We endorse a “Crawl, Walk, Run” as a bridge to move from a state of frustration to one of ongoing success.

Best Practice Bridge
 

The following is offered as a quick checklist of best practices that we have seen work throughout the years.

Address the People Considerations

Bridge - People

People

  • Involve other functions early on
  • Avoid “one-off” single design efforts
  • Link value to key initiatives
  • Ensure visibility of Senior Levels


Consider the Best Process for Development

Bridge - Process

Process

  • Share success with other functions
  • Be intentional with your focus
  • Adopt a crawl, walk, run approach
  • Measure the direct financial impact


Use Focused Technology Techniques

Bridge - Technology

Technology

  • Design for business users (cross-functionally)
  • Apply Agile development techniques
  • Ensure scalability


Turn Data From a Liability to an Asset

Bridge - Data

Data

  • Gain organizational consensus on enterprise data sources (cross-functionally)
  • Focus the data design (not boil the ocean)
  • Invest in repeatable data validation capabilities (organizational trust)


Companies recognize that actionable knowledge that comes from Big Data Analytics is key for survival. Knowledge that allows for informed strategies and decisions that are fact based. Strategies that drive positive and meaningful results. Decisions that allows the organization to out maneuver the competition. Survival will go to those that accurately understand operational performance and the associated drivers.

I would love to know your thoughts on this.  Please comment on this posting or email me at [email protected] .

All the best,

Richard Sharpe

Richard Sharpe

Richard Sharpe is CEO of Competitive Insights, LLC (CI), a founding officer of the American Logistics Aid Network(ALAN) and designated by DC Velocityas a Rainmaker in the industry. For the last 25 years, Richard has been passionate about driving business value through the adoption of process and technology innovations. His current focus is to support CI’s mission to enable companies to gain maximum value through specific, precise and actionable insights across the organization for smarter growth. CI delivers Enterprise Profit Insights (EPI) solutions that enable cross-functional users to increase and protect profitability. Prior to his current role, Richard was President of CAPS Logistics, the forerunner of supply chain optimization. Richard is a frequent speaker at national conferences and leading academic institutions. His current focus is to challenge executives to improve their company’s competitive position by turning enterprise wide data from a liability to an asset through the use of applied business analytics.
Your Moneyball Story

Richard Sharpe Analytics & Big Data

Your Moneyball Story

Summary: Baseball Season is always an exciting time, especially if your Team is knocking it out of the park!  But winning consistently can be a real challenge.  Billy Beane of the Oakland A’s (Moneyball fame) faced this challenge.  Billy became the A’s General Manager in 1997 following a dismal 96-97 year compounded by key players leaving and significant budget cuts.


Billy knew that critical recruitment decisions could not be made using traditional “experience & opinion” based decisions.  He recognized the value in tapping into the abundance of data available on players in the Major and Minor Leagues.

Fighting traditional decision making techniques, Billy drove his staff to find young players or out of favor players who were more productive offensively and defensively.  The result?  The poorest team in baseball with the smallest budget blew past the competition in successive winning seasons.  That is a truly remarkable story.

What is your company’s Moneyball story?  Are you getting repeatable and meaningful insights from your analytics and data initiatives that challenge or compliment historical decision making processes?

Case In Point:  Let’s look at one area that all companies can relate to, pricing discounts.  Traditional sales management techniques focus on sales volume with discount strategies focused on incenting top line growth.  Discounting can be done in many ways but how do you know that it is driving value to your bottom line?

Take a look at the following graph of customer sales verses applied discounts.  Clearly higher sales with lower discounts (the green area) is great.  But what about customers with higher sales and higher discounts (the yellow area)?  A traditional sales assessment would say that this is acceptable to meet revenue growth requirements.  Said another way, the Sales Umpire would say “Your Safe”.

Blog046_Safe2

But let’s add another dimension to evaluate the performance of these customers. Let’s look at the profit generated by these sales.  As you can see below, 38 customers were actually unprofitable.

Blog046_Out2

Giving much higher discounts than average for a customer that is marginal or unprofitable could be the basis for the Umpire to yell “You are out”.  Or it could be smart information that can be used to create more “value based” discounting strategies.

Action:   Supply chains are complex with a lot of variables that can impact Cost To Serve and Net Landed Profit performance.  In today’s highly competitive and volatile market, understanding the financial impact of decisions made to manage these variables is imperative.  It is most likely that in your company there are well established norms associated with driving top line growth and discounts.  What hidden gems are waiting to be found in your operation?

Takeaway:  Billy Beane challenged his staff to fill playing positions in a new way.  Beane focused on player selection based on a specific performance analytics.  They defied conventional wisdom and built their Team using analytics and the data that was available.  Billy found value in players that other teams did not see.

Are there Moneyball opportunities in your operation?  It may not be easy, but at the end of the day, if your measuring yardstick is “earnings per share” versus “sales per share” are you ready to play ball?


I would love to know your thoughts on this.  Please comment on this posting or email me at [email protected] .

All the best,

Richard Sharpe

Richard Sharpe

Richard Sharpe is CEO of Competitive Insights, LLC (CI), a founding officer of the American Logistics Aid Network(ALAN) and designated by DC Velocityas a Rainmaker in the industry. For the last 25 years, Richard has been passionate about driving business value through the adoption of process and technology innovations. His current focus is to support CI’s mission to enable companies to gain maximum value through specific, precise and actionable insights across the organization for smarter growth. CI delivers Enterprise Profit Insights (EPI) solutions that enable cross-functional users to increase and protect profitability. Prior to his current role, Richard was President of CAPS Logistics, the forerunner of supply chain optimization. Richard is a frequent speaker at national conferences and leading academic institutions. His current focus is to challenge executives to improve their company’s competitive position by turning enterprise wide data from a liability to an asset through the use of applied business analytics.

Increasing / Decreasing Costs – “Smart” Cost Decisions

Richard Sharpe Analytics & Big Data

Increasing / Decreasing Costs – “Smart” Cost Decisions

cost-cutting decisions can hurt your most profitable customers

Summary: With the uncertainty of an economic downturn, companies in 2019 will look to cut costs in an attempt to meet shareholders’ earnings expectations.  Typically, cost reduction programs are established by functional areas of the business (sourcing, supply chain, inventory, etc.) and may be tailored to certain groups of customers based on top line revenue contributions. Why is this a problem? Simply stated, not all customers are the same as it relates to their true profit contributions.  In fact, for most companies, a small minority of customers actually provide the vast majority of profits that subsidize marginal and unprofitable accounts. 

Cost cutting decisions made across a customer base can have serious, unwanted consequences.  Reduction in service levels or inventory availability for highly profitable customers can cause them to become dissatisfied and to look to your competition for alternative choices.  The end result, your cost cutting measures may actually have the unwanted effect of significant decreasing the profitable performance of your company.

Case In Point:  Prior to looking for ways to reduce operating costs, a profitable 5 Billion dollar company in Chicago decided to accurately measure the profit contribution of each customer and customer delivery location.  Their customer base comprised of 110,000 delivery locations across the United States.  Want to venture how many locations provided the vast majority of their profits?  Most people would say use the 80 / 20 rule and therefore over 20,000 customer locations.  The actual answer was less than 3%.  Without knowing this and relying on higher level revenue or gross margin information, typical cost cutting measures could have had catastrophic results.

Action:  The approach that this company used for this analysis ensured that the entire organization had confidence in the profit performance information.  As a result, the information was very actionable.  Cost reductions were implemented for the unprofitable and very marginal customers while protecting the service and support of the high yield customer group.

Takeaway:  Wholesale cost reduction programs can be dangerous.  It is imperative to identify customers that provide significant profit contributions to your bottom line and protect that business relationship.  However, determining the root cause for poor performance is equally important.  With that information in hand, cost cutting programs can be tailored to customers or customer segments to not only reduce operating expenses but also improve these customer’s margin contributions.

I would love to know your thoughts on this.  Please comment on this posting or email me at [email protected] .


All the best,

Richard Sharpe

Richard Sharpe

Richard Sharpe is CEO of Competitive Insights, LLC (CI), a founding officer of the American Logistics Aid Network(ALAN) and designated by DC Velocityas a Rainmaker in the industry. For the last 25 years, Richard has been passionate about driving business value through the adoption of process and technology innovations. His current focus is to support CI’s mission to enable companies to gain maximum value through specific, precise and actionable insights across the organization for smarter growth. CI delivers Enterprise Profit Insights (EPI) solutions that enable cross-functional users to increase and protect profitability. Prior to his current role, Richard was President of CAPS Logistics, the forerunner of supply chain optimization. Richard is a frequent speaker at national conferences and leading academic institutions. His current focus is to challenge executives to improve their company’s competitive position by turning enterprise wide data from a liability to an asset through the use of applied business analytics.
Pinpointing Profit Leakage

Richard Sharpe Analytics & Big Data

Pinpointing Profit Leakage

needle in haystack

Summary: Earnings reports are a key indicator of a company’s financial health but they are an aggregation of a vast array of incurred costs and realized revenues associated with running a business.  The financial impact of specific decisions in managing product and customer transactional costs and revenues is typically visible at an aggregate level such as categories of costs or revenues by customer or customer groupings.

However, individual actions or decisions in sourcing, supply chain or sales can significantly impact operating margins and create negative performance exceptions.  Profit leakage exceptions can be hidden in standard financial reporting.  Finding these specific profit leakage opportunities and the root cause can be like searching for a needle in a haystack.

Case In Point: On a monthly basis, a Retailer would have a team of Financial Planning & Analysis Managers perform analysis on procurement, specific supply chain activities and store sales to try and find significant opportunities associated with incurred costs or reductions in revenues.  The process was time consuming and did not catch all of the significant exceptions that needed to be analyzed.  A decision was made to create a scalable approach that would not only review all exceptions but would also track the progress of resolving previously identified items.

Action: To be scalable, the company recognized that the solution had to have several key characteristics.  It had to provide for an approach that would ensure that the data that would be analyzed would be accurate and specific.  The identification of the exceptions needed to be fast and the ones with the biggest impact prioritized.  Finally, the analysis needed to examine opportunities across the entire operation including procurement, supply chain, inventory and sales activities on a recurring basis.  The company selected a cloud-based technology platform  that provided data governance capabilities as well as robust processing and reporting.

With the initial activation of the solution, profit leakage exceptions across every functional area were identified that totaled several million dollars.  What would historically take the company weeks to accomplish was now done on a repeatable basis in a matter of days.

Takeaway:  Profit improvement opportunities can be significant by having the ability to pinpoint exceptions in financial performance by product, customer, store or channel.  For some, the root cause may not be something that can be easily changed.  But for many exceptions, actions can be taken to minimize the future impact on margin erosion.  Having this type of robust and repeatable capability insures that the company is proactively looking for all opportunities to maximize shareholder value.

I would love to know your thoughts on this.  Please comment on this posting or email me at [email protected] .


All the best,

Richard Sharpe

Richard Sharpe

Richard Sharpe is CEO of Competitive Insights, LLC (CI), a founding officer of the American Logistics Aid Network(ALAN) and designated by DC Velocityas a Rainmaker in the industry. For the last 25 years, Richard has been passionate about driving business value through the adoption of process and technology innovations. His current focus is to support CI’s mission to enable companies to gain maximum value through specific, precise and actionable insights across the organization for smarter growth. CI delivers Enterprise Profit Insights (EPI) solutions that enable cross-functional users to increase and protect profitability. Prior to his current role, Richard was President of CAPS Logistics, the forerunner of supply chain optimization. Richard is a frequent speaker at national conferences and leading academic institutions. His current focus is to challenge executives to improve their company’s competitive position by turning enterprise wide data from a liability to an asset through the use of applied business analytics.

Global Survey Results – Recognition, Frustration & Action

Richard Sharpe Analytics & Big Data

Global Survey Results – Recognition, Frustration & Action

The results are in.  At this year’s CSCMP Global Conference in Nashville, the Team of professionals that conduct, analyze and report on the Annual Analytics & Big Data Benchmark Study (Lisa Harrington – lharrington group LLC, Susan Lacefield – Supply Chain Quarterly, Dale Rogers – Arizona State University, Zac Rogers – Colorado State University and myself) presented the findings of this year’s survey (a copy of the presentation can be made available – see below).  The results clearly indicated that companies continue to recognize the need to gain business value from Big Data Analytics but that there is a significant amount of frustration across industries.

Challenges with data, struggling with meaningful analytics and ultimately getting to actionable strategies were clear drivers for this frustration.  As an example, look at the attached graphic on data:

image from www.ci-advantage.com

The good news is that companies are gaining a deeper appreciation for the business value that can be derived from Big Data Analytics and are being more objective with regard to the effort that is needed to achieve that value.  So what are some key steps to cross that gap faster?  Four primary areas and specific actionable steps were cited to drive success as depicted in the following graphic:

image from www.ci-advantage.com

So the race is on.  Companies get the fact that in the fast paced environment that we all operate in today, it is critical to make fact based decisions using the all of the transactional data that is available through a set of business user analytics. Decisions that drive competitive and profitable performance.

For a copy of the presentation, please contact us at [email protected]

Thank you,

Richard Sharpe

Richard Sharpe

Richard Sharpe is CEO of Competitive Insights, LLC (CI), a founding officer of the American Logistics Aid Network(ALAN) and designated by DC Velocityas a Rainmaker in the industry. For the last 25 years, Richard has been passionate about driving business value through the adoption of process and technology innovations. His current focus is to support CI’s mission to enable companies to gain maximum value through specific, precise and actionable insights across the organization for smarter growth. CI delivers Enterprise Profit Insights (EPI) solutions that enable cross-functional users to increase and protect profitability. Prior to his current role, Richard was President of CAPS Logistics, the forerunner of supply chain optimization. Richard is a frequent speaker at national conferences and leading academic institutions. His current focus is to challenge executives to improve their company’s competitive position by turning enterprise wide data from a liability to an asset through the use of applied business analytics.
Analytics & Business Value – How Does Your Company Measure Up?

Richard Sharpe Analytics & Big Data

Analytics & Business Value – How Does Your Company Measure Up?

Blog037_KidFishing
My son loves to fish. Taking pictures of the “big catch” is a great way to share his success with family and friends.  But there is a trick to support the “story”. If you hold the fish as far in front of you as possible, the fish looks significantly bigger than its actual size.

What does this have to do with analytics and business value?

I often wonder when I hear someone talk about their successes in driving business value from analytics whether they are holding the fish a little farther out than reality.  Ever have the same thought?  The fact is that up until recently there was no industry benchmark associated with measuring the true value that companies are recognizing from their supply chain big data analytical efforts.

Well, that changed in 2017.

A team of professionals from Supply Chain Quarterly, the lharrington Group, the Universities of Arizona State and Colorado State along with Competitive Insights designed, issued, analyzed and published the results of the first global survey on this question. The goal was to have an objective benchmark for the progress that companies have actually made in deriving sustainable, actionable value from their big data analytical initiatives.  In addition, barriers to success as well as future prioritized investments were captured.  The results were organized by type of industry and demographics.  Here is a link to the report published in the Q4, 2017 release of Supply Chain Quarterly.

We need your input?

Why?  Simply said, the more companies that participate, the stronger the results.  These results can be used internally to benchmark where you are compared to your peers and to gain an understanding of some of their challenges and priorities for future investment. It only takes a few minutes to complete and all responses are anonymous. Reporting is done by industry statistics and only those statistics are shared.

Look for the survey invitation from Supply Chain Quarterly in the coming weeks.  Participate and help the results be of richer value for your company and the Supply Chain Industry. The results will allow you to see the reality of how you measure up.

All the best,

Richard Sharpe

Richard Sharpe

Richard Sharpe is CEO of Competitive Insights, LLC (CI), a founding officer of the American Logistics Aid Network(ALAN) and designated by DC Velocityas a Rainmaker in the industry. For the last 25 years, Richard has been passionate about driving business value through the adoption of process and technology innovations. His current focus is to support CI’s mission to enable companies to gain maximum value through specific, precise and actionable insights across the organization for smarter growth. CI delivers Enterprise Profit Insights (EPI) solutions that enable cross-functional users to increase and protect profitability. Prior to his current role, Richard was President of CAPS Logistics, the forerunner of supply chain optimization. Richard is a frequent speaker at national conferences and leading academic institutions. His current focus is to challenge executives to improve their company’s competitive position by turning enterprise wide data from a liability to an asset through the use of applied business analytics.

The First Annual Supply Chain Data and Analytics Survey Results Are In – Where Do You Stand?

Richard Sharpe Analytics & Big Data

The First Annual Supply Chain Data and Analytics Survey Results Are In – Where Do You Stand?

Blog35_wave
Have you wondered if other companies have the same level of difficulty and frustration regarding getting real and repeatable value from their supply chain data and analytical efforts?  Well wonder no more.  The results are in from the first global survey answering this question across multiple industries and they are significant.

Using  Competitive Insights’ maturity model that is based on data organization & governance, cross functional utlilization and and the number of actual business analytics being routinely used, the current value being realized across all industries is 33.3% of the full potential value that can be derived from the effective use of supply chain analytics!

These results serve as a baseline for companies to have an unbiased source for measuring where they actually stand as it relates to other companies and industries.  The survey provides findings that will be updated each year.

The results are published in the Q3 2017 issue of CSCMP’s Supply Chain Quarterly.  The responses provide insights and answers to critical questions including:

  1. What is the current satisfaction with the following four attributes of the data you need to do supply chain analytics?
  1. What are the primary forms of technologies usedforyour supply chain analytics?
  1. What types of analytics are your organization taking the most advantage of?
  1. What are the most significant barriers that you have in getting more value?
  1. What benefits have you realized to date from your supply chain analytical investments?

Want to know more?  If you already subscribe to Supply Chain Quarterly, then the answers are on the way.  If not, you can read the article HERE.

Once you review this information, use it to drive your own internal discussions.  Measure your results against other companies.  Learn how you might take actions to obtain the maximum value out of your supply chain analytical investments!  And just as important SIGN UP NOW to participate in next year’s survey!

All the best,

Richard

Richard Sharpe

Richard Sharpe is CEO of Competitive Insights, LLC (CI), a founding officer of the American Logistics Aid Network(ALAN) and designated by DC Velocityas a Rainmaker in the industry. For the last 25 years, Richard has been passionate about driving business value through the adoption of process and technology innovations. His current focus is to support CI’s mission to enable companies to gain maximum value through specific, precise and actionable insights across the organization for smarter growth. CI delivers Enterprise Profit Insights (EPI) solutions that enable cross-functional users to increase and protect profitability. Prior to his current role, Richard was President of CAPS Logistics, the forerunner of supply chain optimization. Richard is a frequent speaker at national conferences and leading academic institutions. His current focus is to challenge executives to improve their company’s competitive position by turning enterprise wide data from a liability to an asset through the use of applied business analytics.