Smartly Pinpoint Significant Cost Reduction Opportunities
Accurately Understand SKU Level Cost and Profit Performance

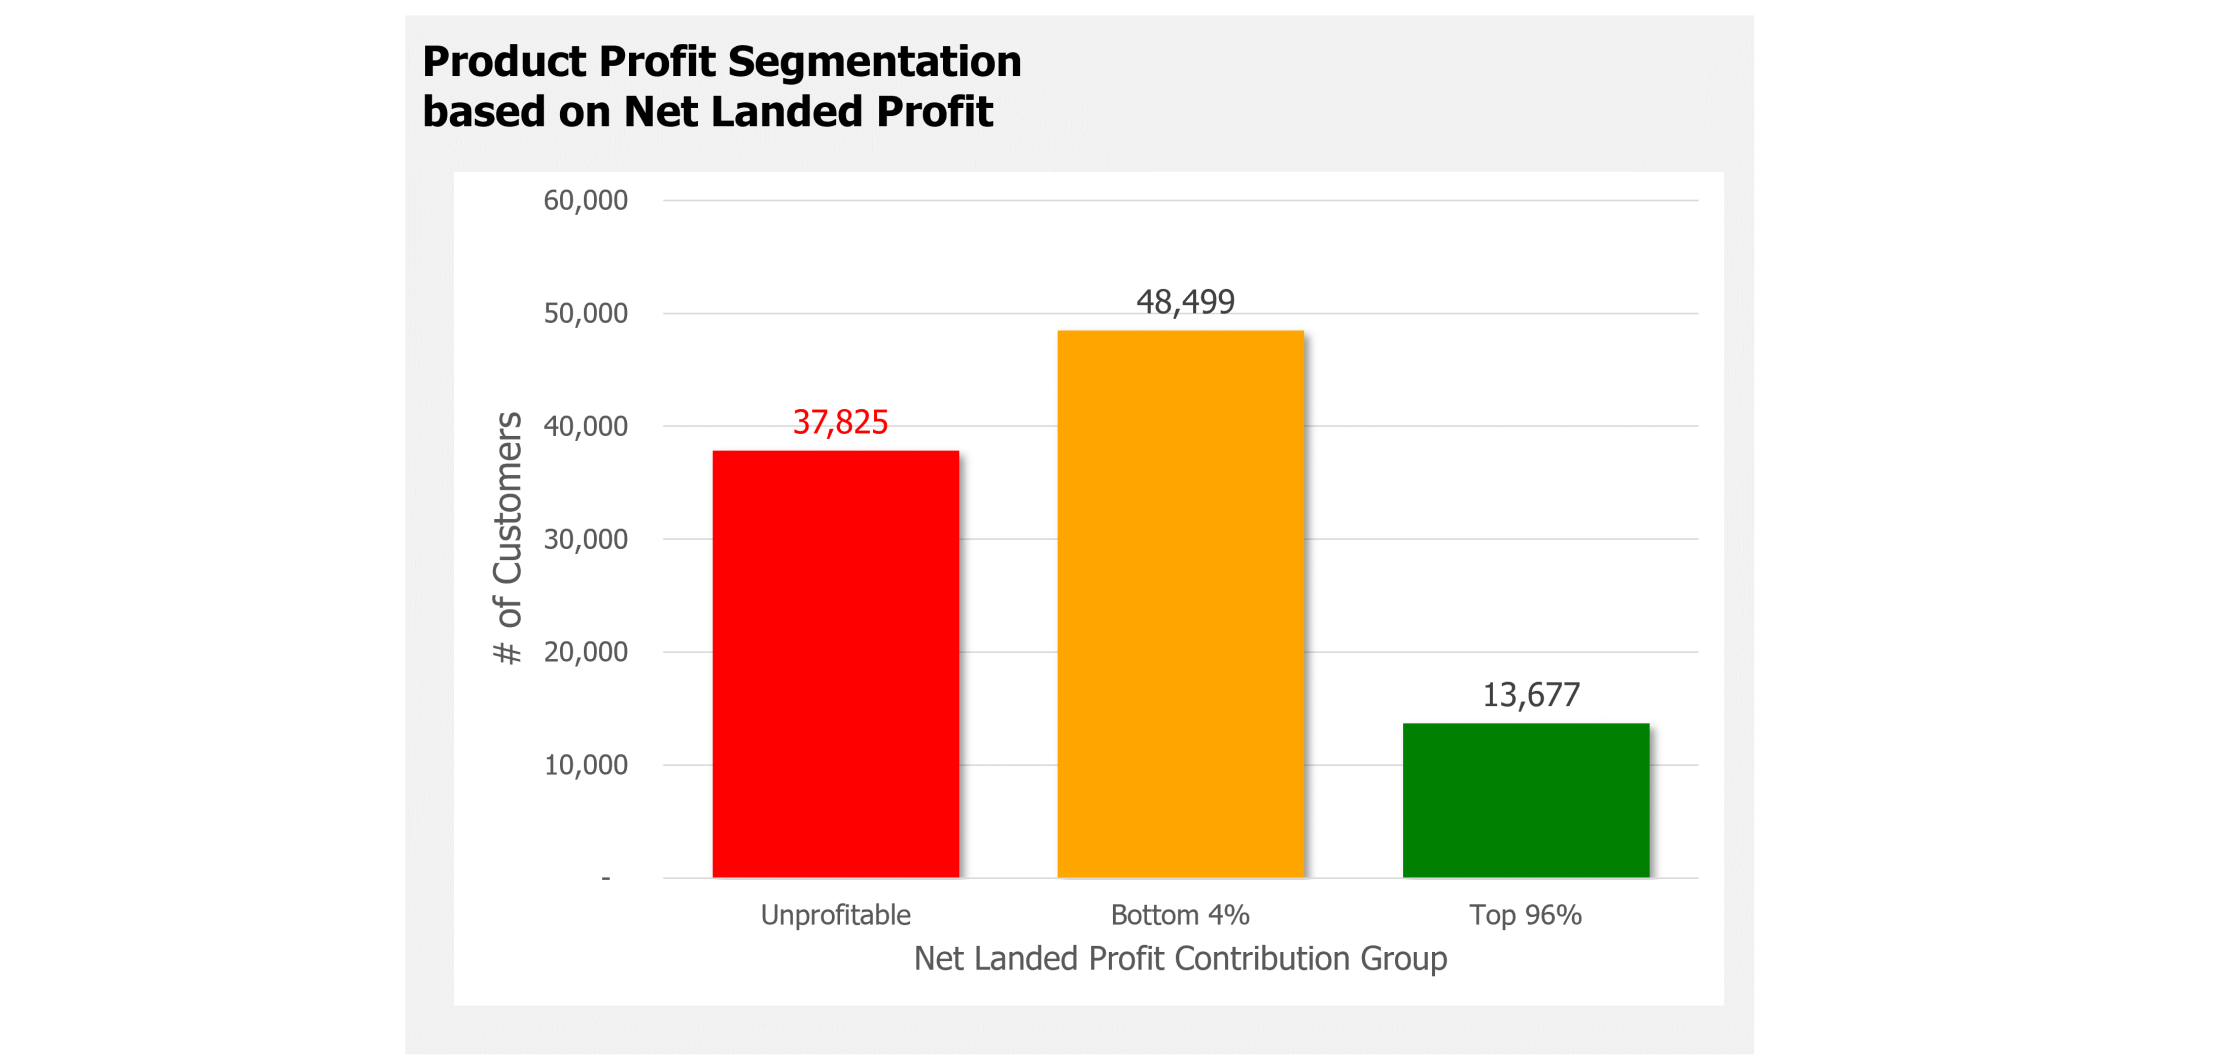
37,825 unprofitable products adding $608 million in operating costs and draining $146 million from the profitable performance of the company
Companies are pursuing aggressive strategies to reduce costs and operating complexity while still delivering expected profit contributions and shareholder value. Using price increases, package down-sizing and re-negotiating supplier agreements can have damaging, long-term impact on customer and supplier relations.
In contrast, some progressive companies are taking a more proactive approach to reduce cost and operational complexity by doing a rigorous review of their product portfolio. (Osprey – Hydroflask: https://www.supplychaindive.com/news/osprey-hydroflask-helen-of-troy-supply-chain-overhaul/649176/ )
Another case in point is for a well-known global company that continued to increase the size of its Product Portfolio sold through three different Channels. The global Head of the Supply Chain knew that this was adding operational complexity and costs. He also knew that the answer to solving this problem was to gain accurate, specific and repeatable cost and profit performance for every SKU in their portfolio.
As with most companies, this company had a host of data sources that were siloed and difficult to use. Having previous experience with these issues, he charged his organization to find a solution that was scalable and that would provide a significant ROI every month. A solution was selected and found the following results:


